How to Measure Core Web Vitals in 2025
A comprehensive list of tools available for measuring Core Web Vitals, along with their key features in 2025.
Introduction
There are several ways to measure Core Web Vitals.
In this article, I’ll introduce a variety of tools available for measurement, along with their unique features and ideal use cases.
If you’re unfamiliar with Web Vitals or Core Web Vitals, I recommend checking out the following article first.
Core Web Vitals Measurement Tools
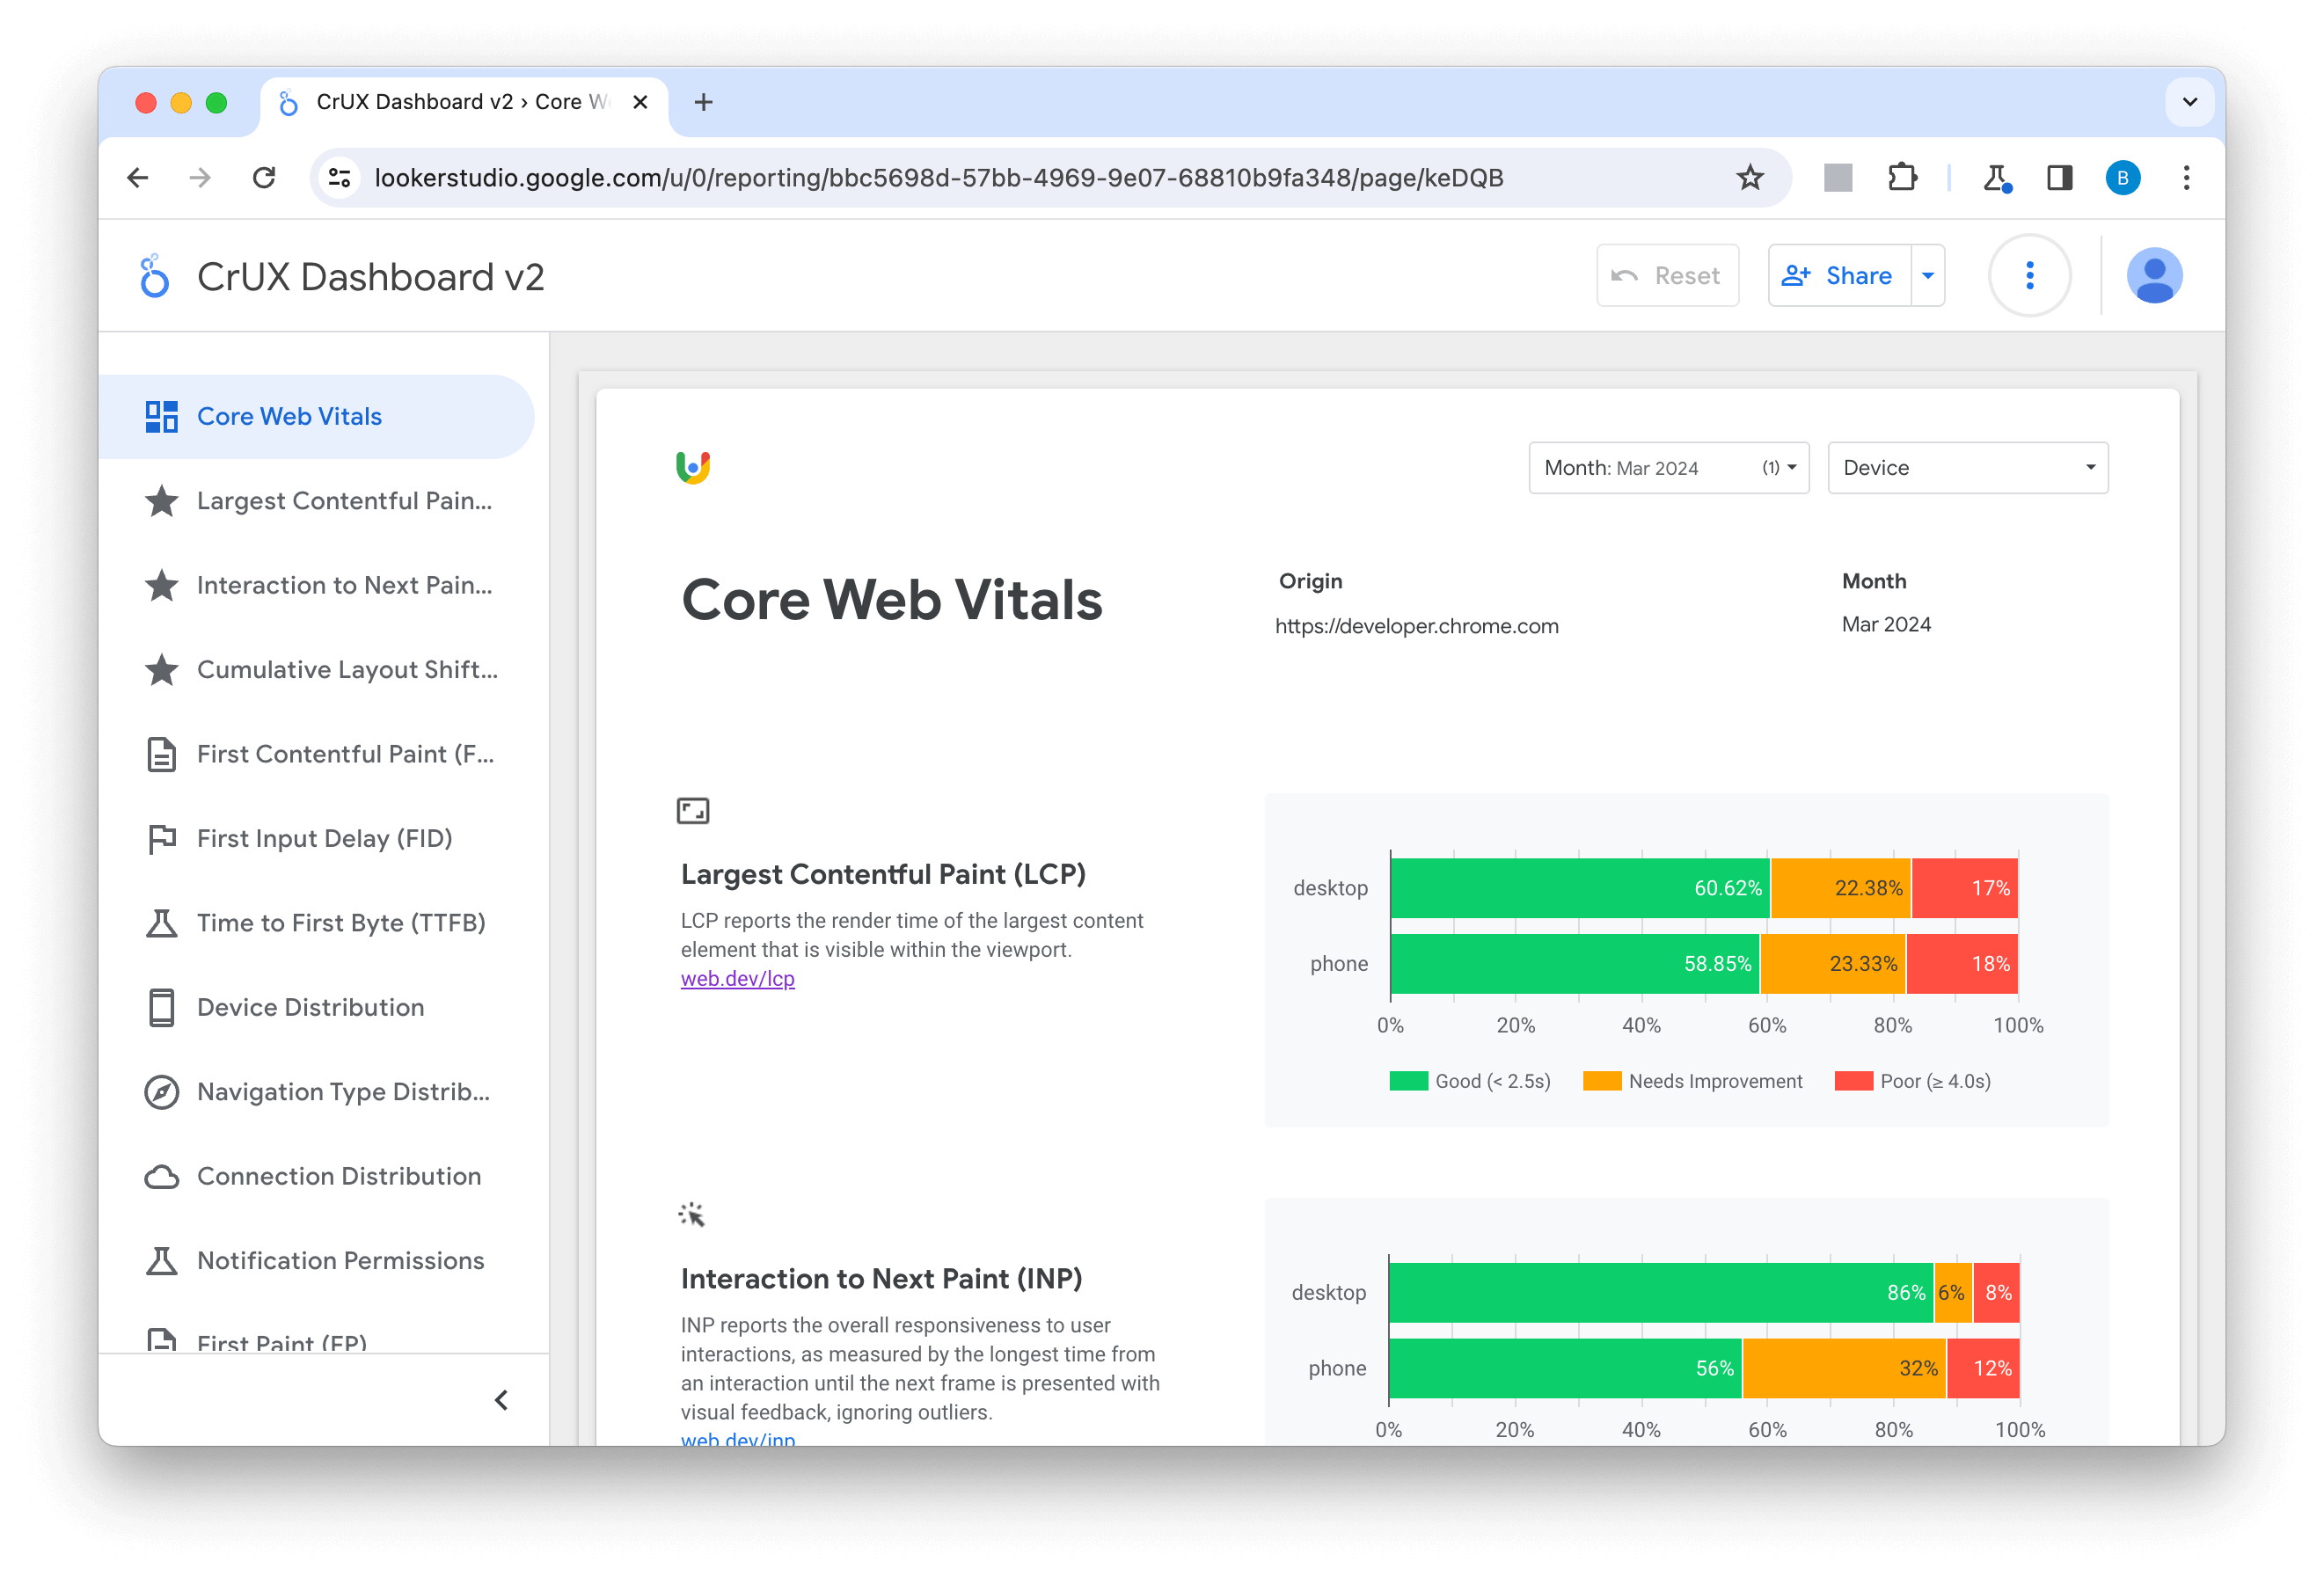
1. Chrome User Experience Report (CrUX)

Key Features
- Available only for publicly accessible and high-traffic websites (i.e., popular sites).
- To view the data, integration with platforms like the CrUX Dashboard (Looker Studio) or BigQuery is required.
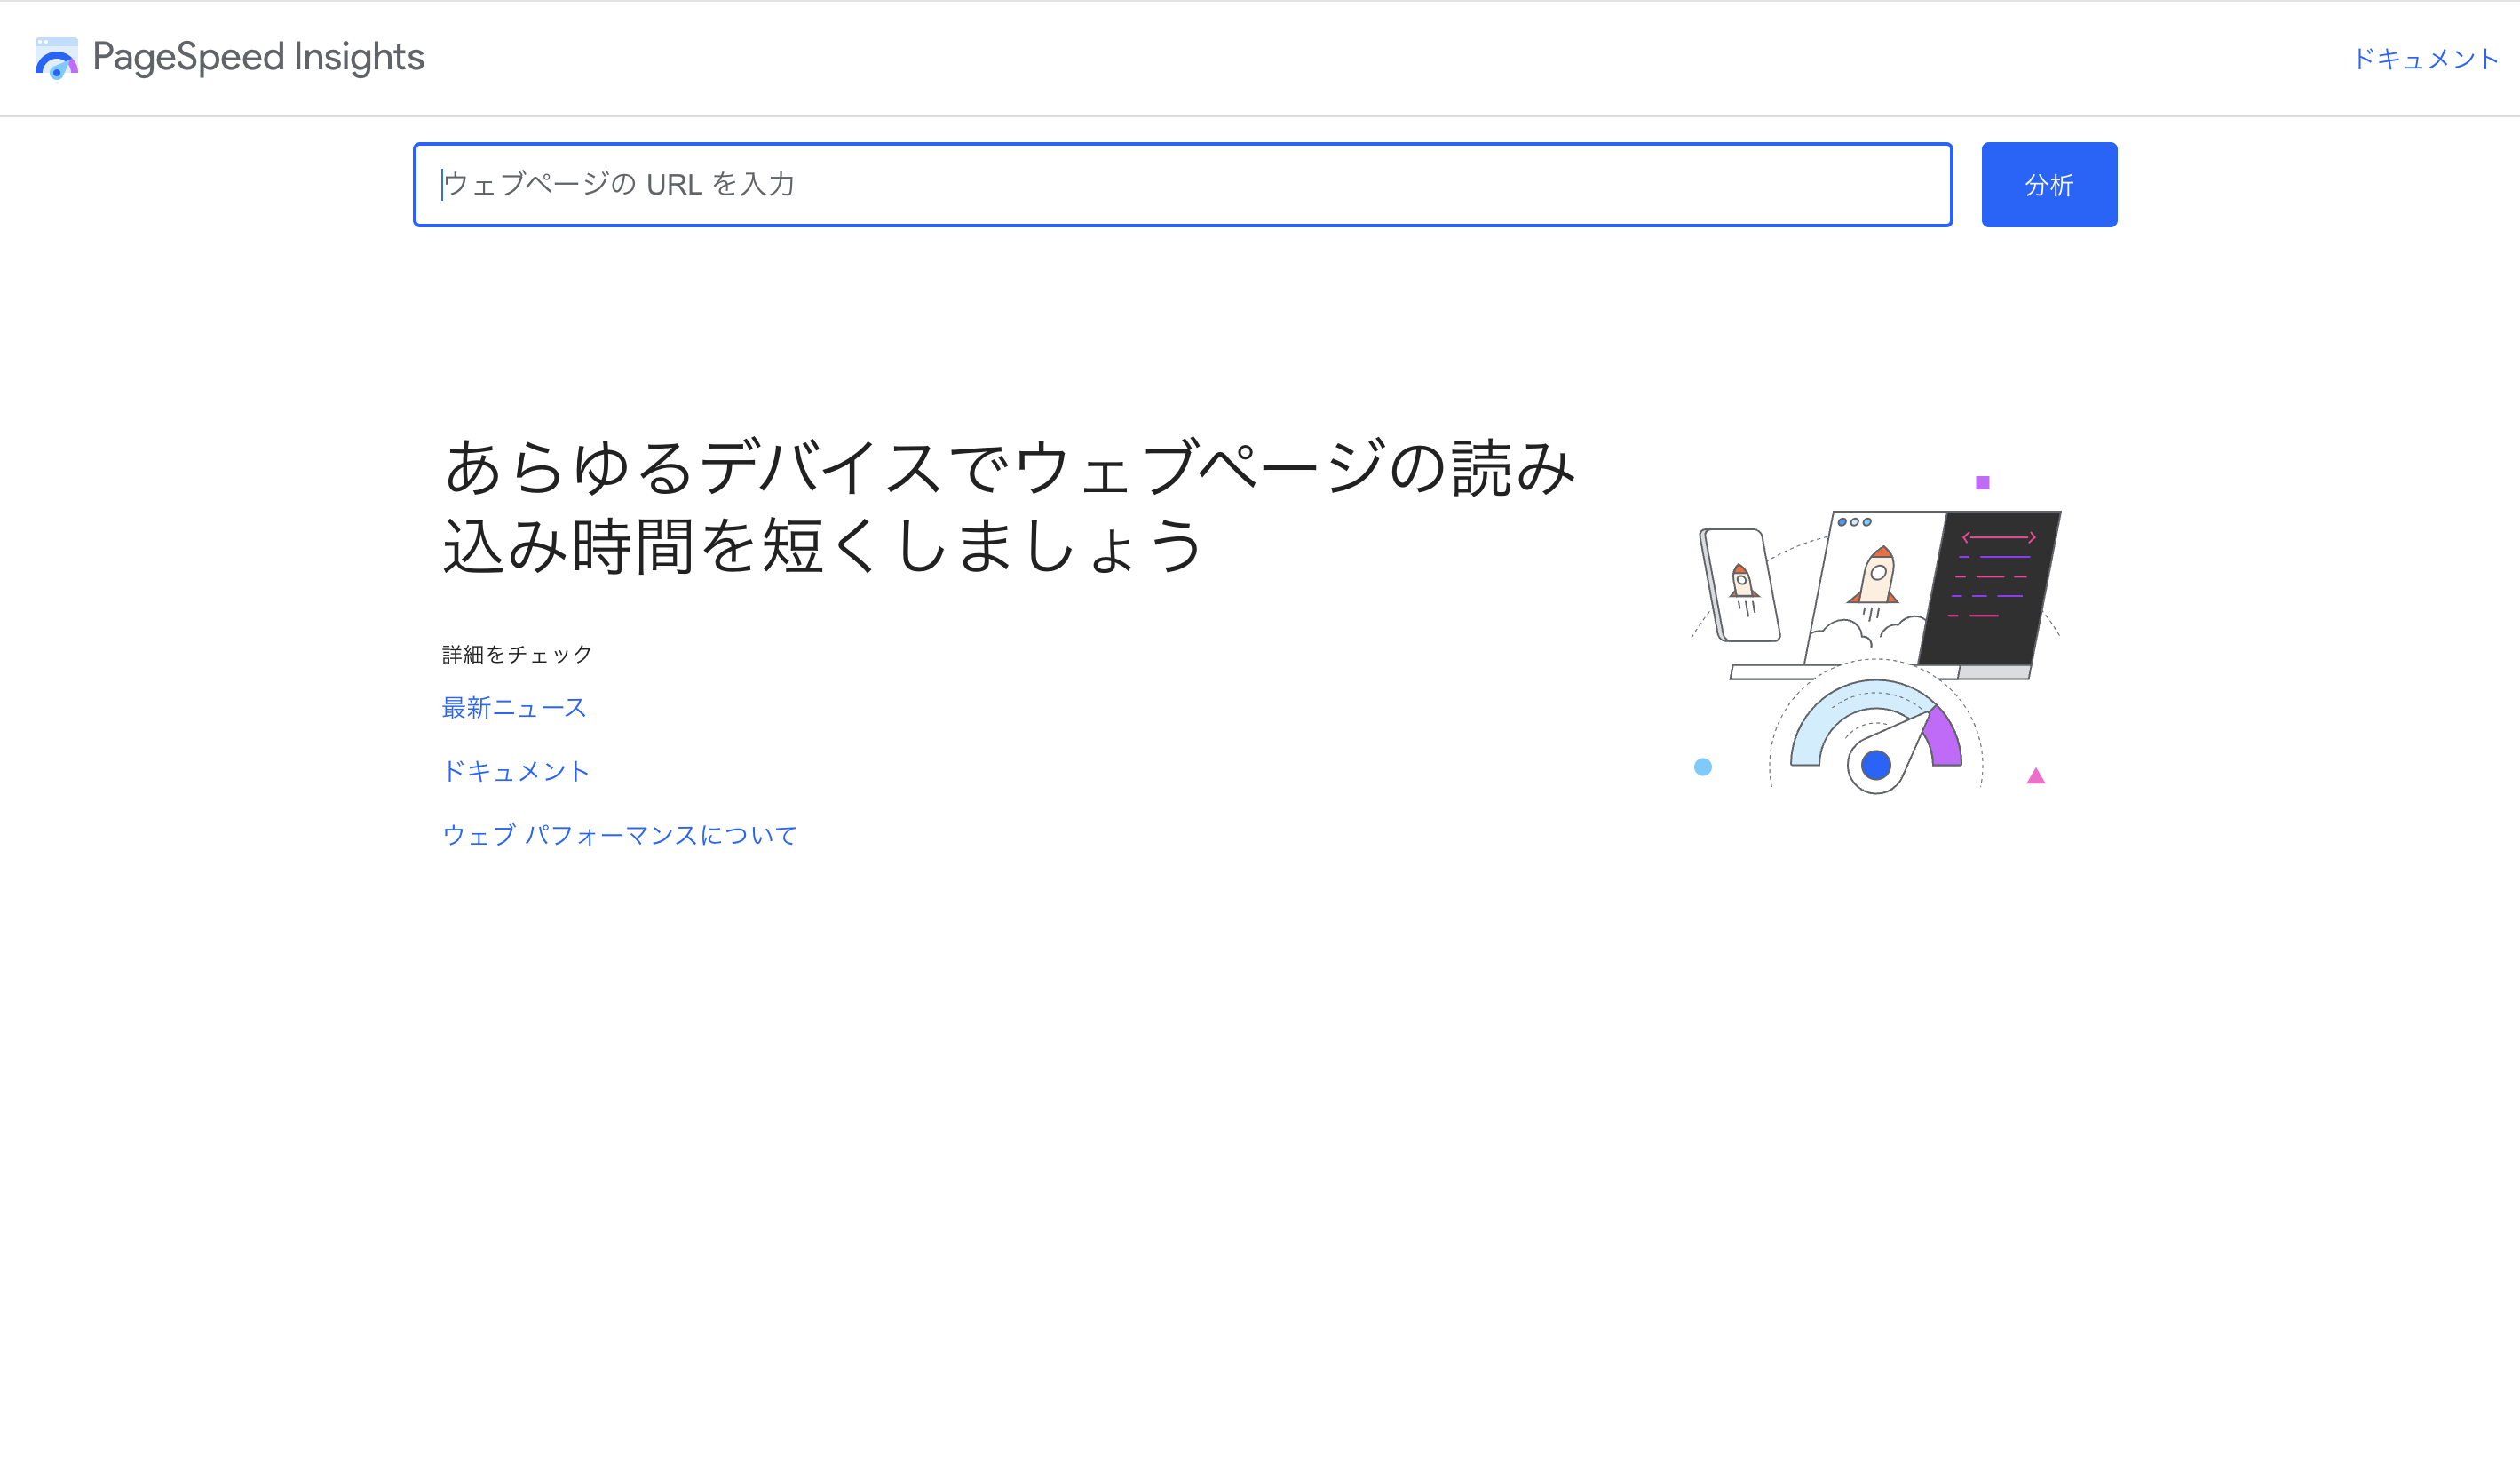
2. PageSpeed Insights

Key Features
- Allows simple, page-level measurement just by entering a URL.
- Anyone can use it, even if they don't own the domain, as long as the site is public.
3. Google Search Console
https://search.google.com/search-console
Key Features
- Available only to verified domain owners.
- Provides performance reports and measurements for individual pages.
- Enables performance comparisons over time and more detailed analysis.
4. JavaScript Library Integration (web-vitals)
You can also integrate web-vitals, the JavaScript library, directly into your application.
Key Features:
- Supports custom implementations, such as sending only specific Core Web Vitals metrics.
- Allows you to define where data is sent, such as Google Analytics or Google Tag Manager.
If you’re hosting your web server on Vercel, you might find @vercel/speed-insights to be a convenient alternative.
To learn how to implement @vercel/speed-insights, check out the following article.
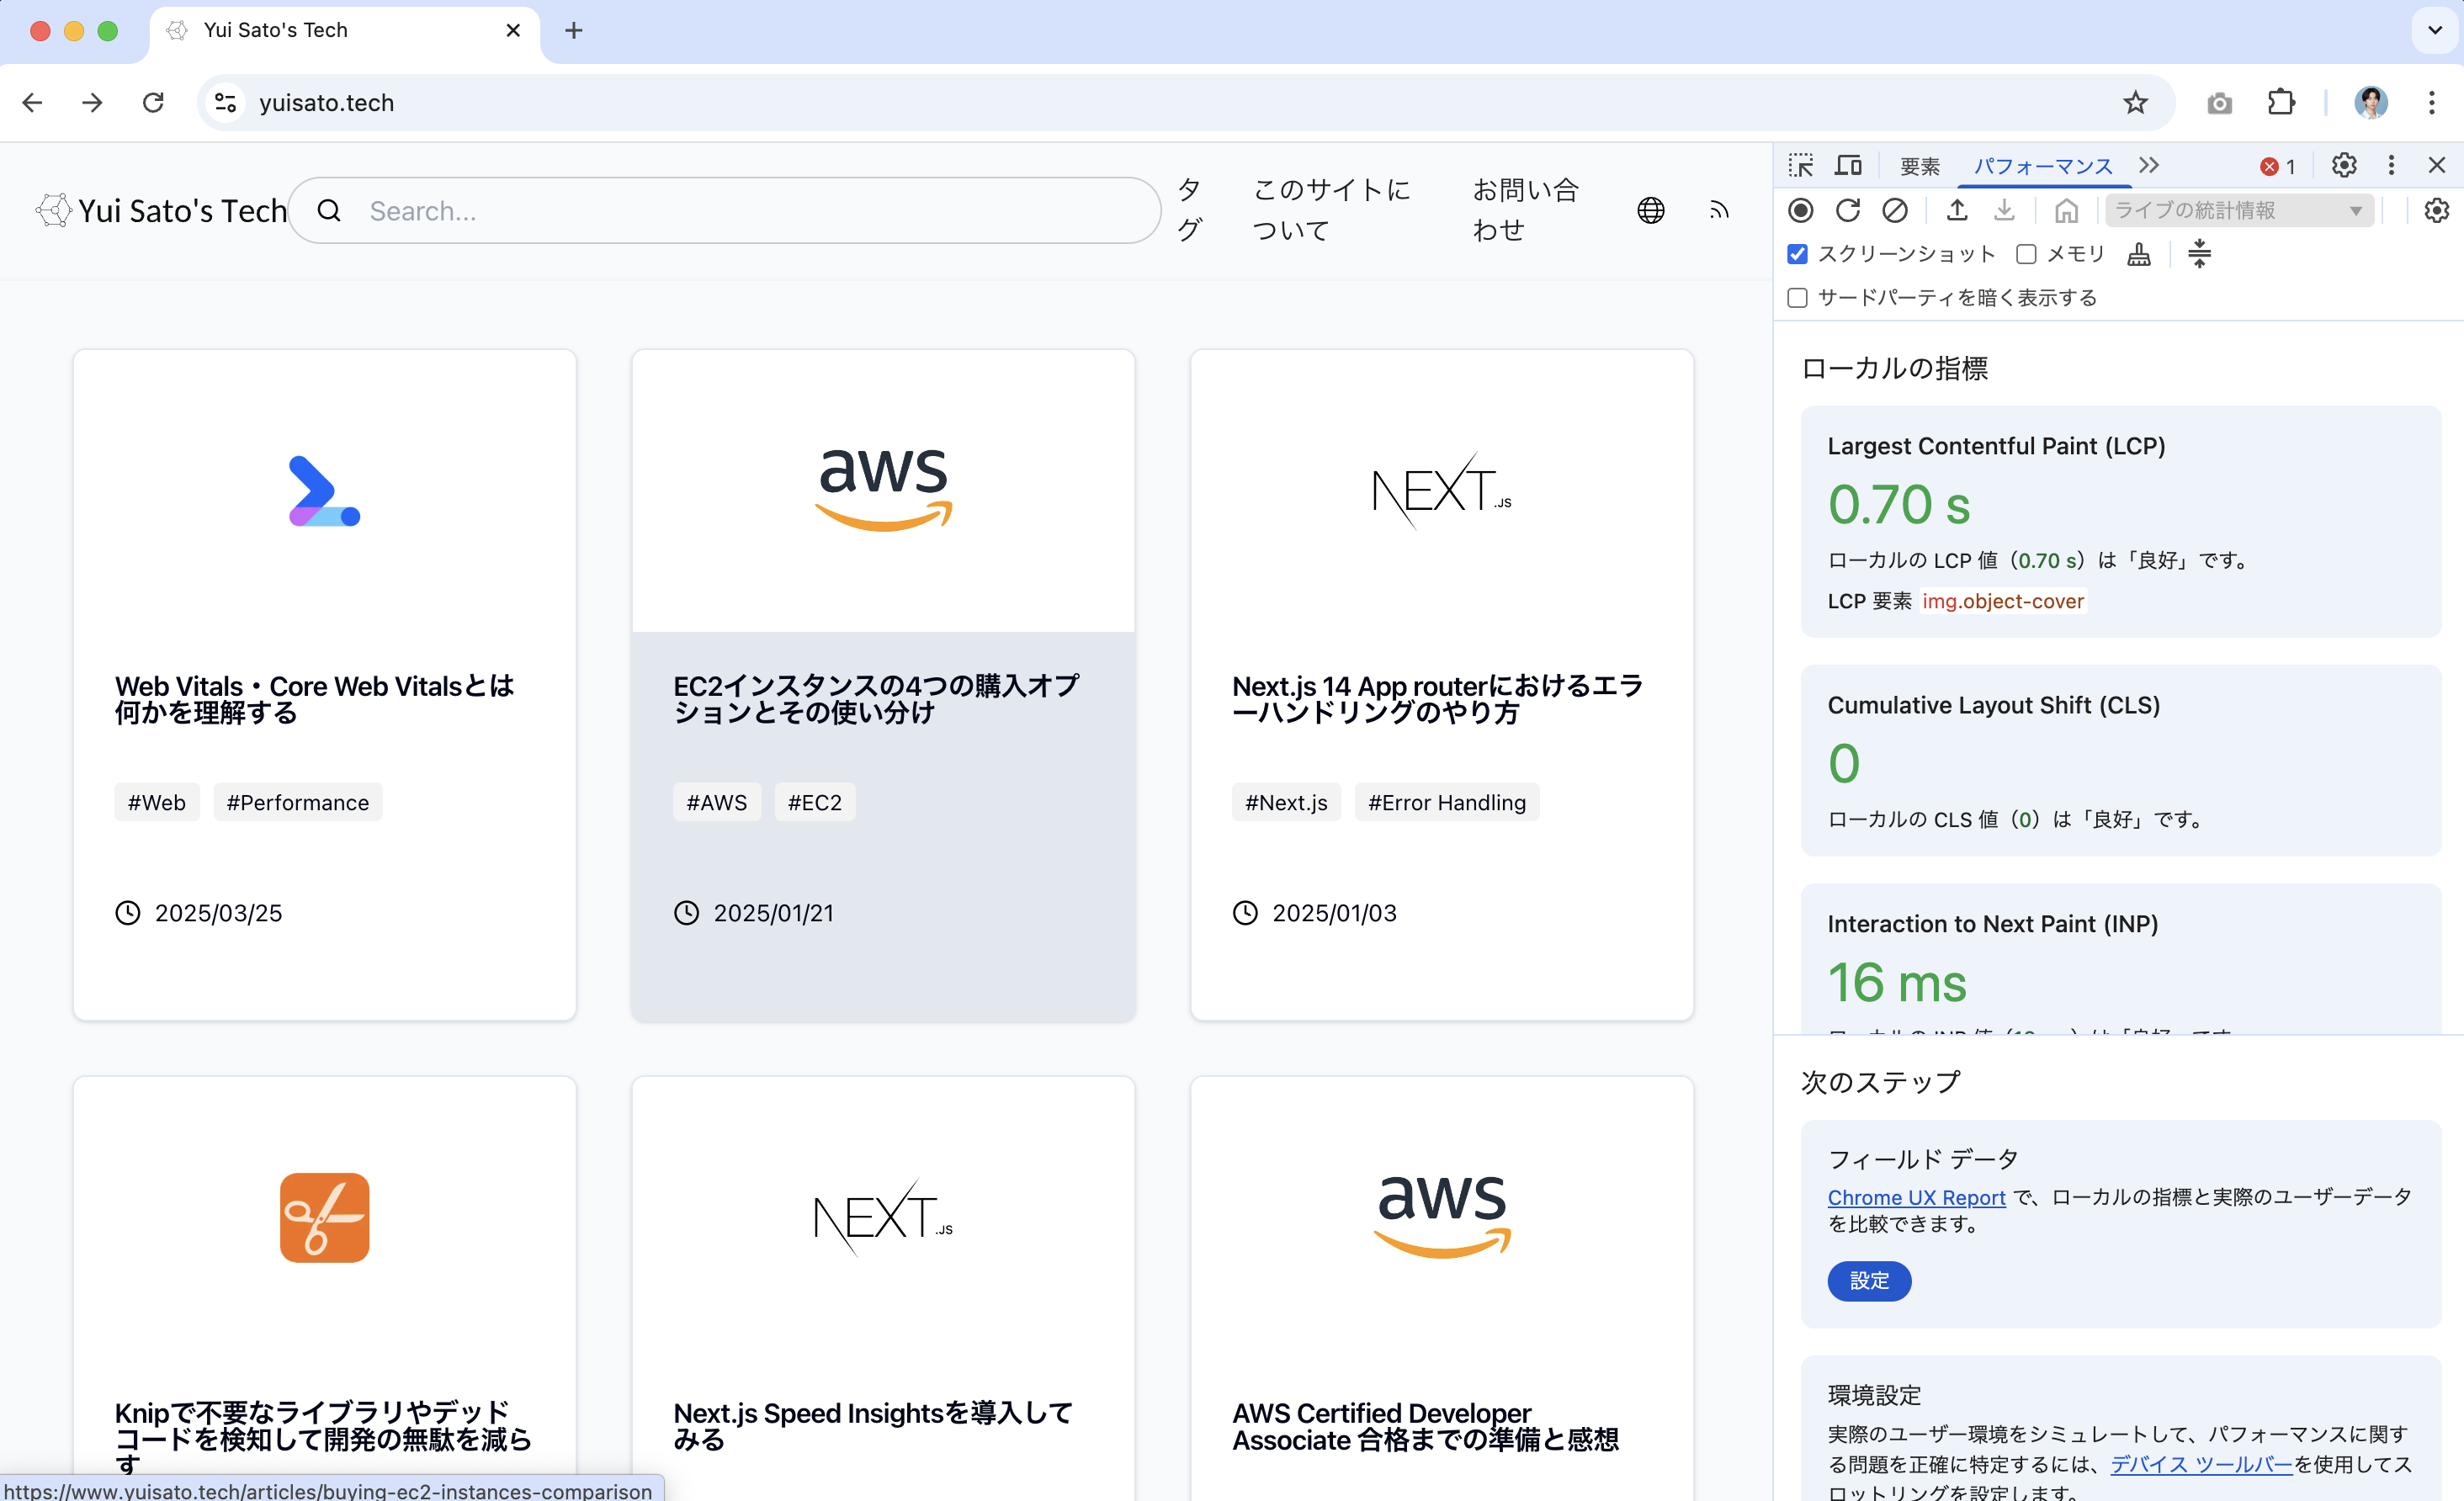
5. Chrome Devtools

Key Features
- You can measure real-time local data via the Performance panel for testing.
- With proper setup, you can compare real user metrics with local measurements.
- Ideal for debugging purposes.
Note on Lighthouse
Lighthouse is a powerful performance analysis tool, but it's not included here since it does not support INP (Interaction to Next Paint), one of the Core Web Vitals. Instead, it reports Total Blocking Time (TBT) as an alternative.
Quick Comparison Table of Core Web Vitals Tools
Name of the tool | Field data | Lab data | Usecase |
|---|---|---|---|
CrUX | ○ | × | You’re not concerned about real-time measurement and just want an overview of the metrics. |
PageSpeed Insights | ○ | ○ | When you want to get a quick diagnosis of a specific page. |
Search Console | ○ | × | When you want detailed comparisons between pages or over time. |
JavaScript Library Integration | ○ | × | When you already have a centralized dashboard for metrics. When other tools don’t meet your custom data requirements. |
Chrome Devtools | × | ○ | When you want to get a quick diagnosis of a specific page. |
Lighthouse* *Only applicable if using TBT as a substitute for the INP metric is acceptable. | × | ○ | When you want to debug the overall performance of a page. |